I studied Retail Management at Bournemouth University. After graduating, I worked across departments and in a consulting capacity with some of the biggest names in UK retail: B&Q, Tesco, WH Smith, and Asda. So when I founded Shakes 2GO, my milkshake and smoothie shop, I had a firm grip on the financial side of running a retail business before the doors opened.
Most independent café and retail owners don't come from that background. They come from a passion for the product, or a gap in the market they decided to fill. Nothing wrong with that. But the financials don't care about your passion. They just tell you whether the business is working or not.
The problem is most owners track a handful of numbers at best, usually just what the bank account looks like on a Friday. This post covers the financial KPIs (Key Performance Indicators, the numbers that tell you whether the business is actually working) worth tracking properly, what they mean, and what they're telling you.
Turnover (Sales Revenue)
Turnover is the total money your business takes in from sales, before any costs come out.
To put some context around it: the average turnover for a small independent coffee shop in the UK sits between £100,000 and £150,000 per year. If you're comfortably above that, good. If you're below it, the question isn't just how to grow revenue. It's whether your cost base is structured to be viable at your current level of trade.
If you sell 200 coffees a day at £3.50 each, daily turnover is £700. Six days a week, that's £4,200. Run it across a full year and you're sitting at roughly £218,400, before you've spent a penny on coffee beans, milk, rent, or wages.
A word of warning here. Turnover is the number most business owners lead with when they're talking about how well things are going. It's also the most misleading. There's an old saying in business: turnover for vanity, profit for sanity. It's quoted a lot because it's true. A shop doing £500,000 a year and spending £490,000 to do it is in a worse position than one doing £150,000 with solid margins. Size is not the same as success. Don't confuse the two.
Track it weekly, monthly, and annually. The pattern matters as much as the total. Knowing that February is always 30% down on December doesn't just explain a quiet period. It lets you plan for it.
Gross Profit
Gross profit is what's left after you subtract the direct cost of making or buying what you sell.
Gross Profit = Turnover minus Cost of Goods Sold (COGS)
Cost of Goods Sold covers the raw materials that go directly into your products. For a café: coffee, milk, syrups, cups, lids. For a retailer: the wholesale cost of the stock you've sold.
If you took £10,000 in sales last month and your COGS was £3,500, gross profit is £6,500.
That £6,500 is the money available to pay everything else: rent, staff, utilities, marketing, and eventually yourself. Plenty of cafés run busy services, good footfall, decent reviews and still fail because this number isn't high enough to cover what comes next.
Gross Profit Margin
Margin puts gross profit into percentage terms so you can compare it against benchmarks and track it over time.
Gross Profit Margin = (Gross Profit / Turnover) x 100
Using the example above: (£6,500 / £10,000) x 100 = 65%.
Specialty coffee shops in the UK tend to run gross margins of 60–70%. Food-led cafés sit lower, around 50–65%. Product retailers vary a lot depending on category and supplier relationships.
The benchmark matters less than the direction of travel. If your margin was 64% six months ago and it's 59% now, something has changed. Either your prices haven't kept up with input costs, your supplier costs have crept up quietly, or wastage is eating into product. Knowing your margin doesn't fix the problem. It just means you catch it before it gets worse.
Net Profit
Net profit is what's left after every single cost has been paid. Not just COGS, but everything.
Net Profit = Gross Profit minus Operating Expenses
Operating expenses cover rent, business rates, staff wages, insurance, utilities, software, accountant fees and every other overhead the business carries.
This is the real number. It's what the business actually earned. Everything else is useful context. Net profit is the verdict.
For independent cafés and retailers right now, the net profit conversation is particularly painful. Energy costs rose sharply and, while they've come back from their peak, they're still significantly higher than they were pre-2022. Business rates have increased. The National Living Wage rose to £12.71 per hour in April 2026, and employer National Insurance contributions went up at the same time. According to payroll specialists Whyfield, the total employer cost of a full-time worker on the National Living Wage has increased by 62% over the past five years. That is not a rounding error. It is a structural shift in what it costs to run a staffed business.
A café running comfortably on a 10% net margin three years ago may be sitting at 4% or 5% now without having changed anything about how it operates. That's not bad management. That's the cost environment. But it does mean the gross margin that felt adequate before no longer is, and prices or volumes need to move to compensate.
A lot of independent businesses have acceptable gross margins and almost no net profit because overheads crept up while revenue stayed flat. Tracking gross and net together shows you exactly where the problem is sitting and whether you need to address the cost side, the revenue side, or both.
On the cost side, cutting operating expenses is one of the most direct ways to improve net profit without needing to grow revenue at all. Renegotiating supplier contracts, switching energy tariffs, reviewing software subscriptions, tightening staff scheduling to reduce unnecessary hours. None of these are glamorous, but each one drops directly to the bottom line. A café that saves £500 a month in controllable costs has improved its annual net profit by £6,000 without serving a single extra coffee.
The Danger of Using Your Bank Balance to Judge Profitability
This one catches more business owners out than almost anything else, so it's worth addressing directly.
Your bank balance is not your profit. It tells you how much cash is sitting in the account right now. It says nothing about what you owe, what's about to leave, or whether the revenue that came in is actually yours to spend.
The most dramatic example of this is wedding venues. A venue taking bookings for events 12, 18, or 24 months out will collect deposits that sit in the current account for a long time before the event takes place. The bank balance looks enormous. The owners feel like the business is flying. In reality, much of that money is a liability. It belongs to couples who booked, and if anything goes wrong before the wedding, it has to go back. Some venue owners have spent that money treating it as profit, then found themselves unable to honour bookings or refund cancellations. The bank balance gave them the illusion of profitability.
Cafés and most retail businesses don't tend to hold customer deposits in the same way, so the risk isn't quite as dramatic. But the principle applies. A strong week of trading, a lump sum coming in from a catering job, or a busy seasonal period can all make the bank account look healthier than the underlying business actually is. Meanwhile, a VAT bill, a supplier invoice, or a quarterly rent payment is sitting just around the corner.
The only reliable way to know whether your business is profitable is a monthly profit and loss management account. Not a bank statement. Not a rough mental calculation. An actual P&L that shows revenue, costs, and what's left over, for each month individually.
That monthly view matters because it shows you the months where you're not profitable, which almost every café has. January after the Christmas rush. The quiet stretch mid-February. A wet week in October. Once you can see those dips clearly, you can do something about them instead of just hoping they pass.
Run a baking course on a quiet Tuesday. Hold a coffee bean tasting morning for regulars who'd genuinely enjoy it. Put on afternoon teas for a few Saturdays in February when footfall is thin and the place would otherwise be half empty. Or do a session on how to make great coffee at home and sell bags of beans on the way out. None of these require significant investment or a rethink of what the business is. What they do require is planning far enough in advance to actually fill them, and you can only do that when you know which months typically need the help.
This is also where having a customer database becomes genuinely valuable. If you know who your regulars are and have a way to reach them directly, you can promote these events to people who already like you and are predisposed to say yes. A café that can send a message to 400 regular customers in January letting them know about a baking course in February is in a completely different position to one that has to rely on a poster in the window and hope someone notices. The database doesn't just make marketing easier. It changes what's commercially possible in your quieter months.
Building that database takes time, but the sooner you start the more useful it becomes. Even collecting names and phone numbers at the point of purchase, or encouraging customers to sign up through a loyalty scheme, gives you something to work with. PerQ's optional data collection feature lets customers share their name and phone number when they add the digital stamp card to their wallet, which means every new loyalty sign-up can become a contact in your database. That list of regulars is an asset. Most cafés don't treat it like one.
The P&L (Profit and Loss Statement)
The P&L is a formal record of revenue, costs, and profit over a set period, usually a month, quarter, or year.
A basic structure looks like this:
Revenue (Turnover)
Less: Cost of Goods Sold
= Gross Profit
Less: Operating Expenses
= Net Profit (or Net Loss)
If you're not looking at a P&L at least monthly, you're making decisions without the full picture. Your accountant can produce one. Most bookkeeping platforms generate them automatically. The discipline is actually reading it, understanding each line, and asking questions when something doesn't look right.
One honest caveat: a P&L only tells you what happened. It doesn't tell you why. Use it alongside your instinct and operational knowledge, not as a replacement for it.
The Balance Sheet
The P&L covers a period of time. The balance sheet is a snapshot of where the business stands on a specific date.
It has three parts:
Assets: what the business owns (cash, stock, equipment, money owed to you by customers)
Liabilities: what the business owes (loans, supplier invoices, VAT due)
Equity: the difference between the two
A business with assets exceeding liabilities is in a healthy position. A balance sheet where liabilities are climbing and cash is shrinking is a warning sign, even when the P&L looks reasonable. The P&L can show profit while the business is running out of cash. It happens more often than you'd think.
Most single-site independents won't spend a lot of time on the balance sheet day to day. But reviewing it quarterly with your accountant is worth doing, especially if you're carrying any debt or planning investment.
How to Calculate Individual Product Costs
Most business owners know their overall margin. Far fewer know the margin on each individual product. That gap is where a lot of profit quietly disappears.
For a café, product costing means calculating the exact cost of every ingredient in a drink or dish, down to the gram. But ingredients alone don't tell the full story. You also need to factor in the labour cost to make each item, and then add a percentage on top to cover your overheads.
Step 1: Ingredient costs
List every ingredient and work out exactly how much of each one goes into a single serving. This sounds simple but it requires actually measuring things rather than estimating. When I was running Shakes 2GO, the way I worked out milk costs was practical and repeatable. I poured the amount of milk I used for one milkshake into a cup, then tipped that into a measuring jug to get the exact volume. From there I could calculate how many milkshakes I could make from one full bottle of milk, then divide the cost of that bottle by the number of milkshakes. If an ingredient only made up part of the recipe, you work out the fraction of it you're using and cost accordingly. So if a banana costs 25p and your milkshake only uses half a banana, the ingredient cost for that item is 12.5p, not 25p.
Apply the same logic to everything. Weigh your coffee dose on scales rather than guessing. Measure your milk pour. Count how many portions you get from a standard supplier unit. Then divide the unit cost by the number of portions. That's your per-serving ingredient cost and it's the only version that's actually accurate.
Step 2: Labour cost
Take the hourly wage, divide by 60 to get the cost per minute, then multiply by how long the item takes to make. The current UK minimum wage for adults over 21 is £12.71 per hour from April 2026, which works out at £0.21 per minute. A flat white takes around three minutes from start to finish at café pace (espresso pull, steaming, pour), so the labour cost is £0.64.
Step 3: Overhead recovery
Your ingredient and labour costs don't account for rent, utilities, marketing, insurance, or any of the other costs the business carries. A practical way to cover those is to add 40% on top of your combined ingredient and labour cost. It's not a perfect science, but it gives you a working true cost to make decisions from.
Flat White example:
| Espresso (18g) | £0.22 |
| Whole milk (200ml) | £0.18 |
| Cup and lid | £0.08 |
| Labour (3 mins at £12.71/hr) | £0.64 |
| Ingredient and labour subtotal | £1.12 |
| Overhead recovery (40%) | £0.45 |
| True cost | £1.57 |
| Selling price | £3.90 |
| Gross margin | 60% |
Still a profitable product. But the margin has moved from 88% (ingredients only) down to 60% once you account for the full cost of making it. The 88% figure feels good. The 60% is the one you should actually be using.
Wastage and spillage
There is one more cost that most café owners either ignore or dramatically underestimate: wastage.
Milk gets knocked over. Coffee grounds get tamped incorrectly and a shot gets pulled again. Food items hit their use-by date before they sell. A batch of something gets made wrong and goes in the bin. In a busy café kitchen none of this is unusual and all of it costs money.
The honest way to account for wastage is to track it for a month. Keep a simple log by the counter or in the kitchen. Every time something gets thrown away or redone, write it down with an approximate cost. At the end of the month, add it up. For most cafés the figure is higher than expected.
Once you know your wastage figure, you can either build it into your product costs as a percentage uplift, or treat it as a separate line in your P&L. Either way it needs to be somewhere. A product that looks like it's running at 60% margin on paper might actually be sitting closer to 55% once you factor in what ends up in the bin. Over hundreds of transactions a week, that gap adds up to a meaningful amount of money.
The traffic light system
Once you've done this exercise across your full menu or product range, you can apply a simple traffic light rating to each item.
Green means the margin is strong. The product is earning its place. Amber means the margin is acceptable but worth watching, especially if input costs rise. Red means the product is barely covering its costs and needs attention.
Red doesn't automatically mean remove it. B&Q almost certainly don't make meaningful money on bags of cement. But they stock it because a DIY shop that doesn't sell cement isn't really a DIY shop. Some products exist to complete your offer, not to drive your profit. That's a legitimate reason to keep a red-rated product on the shelf.
What you do need to be ruthless about is the other kind of red: the product you're keeping out of habit, sentiment, or personal taste rather than any commercial logic.
When I was running Shakes 2GO I had a real soft spot for Tunnock's Wafers. Personally, I love them. So I stocked them. The problem was that nobody else seemed to share my enthusiasm. They just sat there. They weren't part of our offer in any meaningful way, they weren't driving footfall, and they weren't selling enough to justify the shelf space. I eventually had to accept that my opinion of Tunnock's Wafers was not shared by my customers, and I removed them.
It's a small example, but the principle applies to much bigger decisions. If a product isn't selling and isn't strategically important to your range, the emotional attachment to it costs you money every week it stays on the menu.
Average Transaction Value (ATV)
Before getting into ATV specifically, it's worth stepping back. There are only three ways to grow revenue in any retail or café business:
- Get more new customers through the door
- Get existing customers to visit more often
- Get existing customers to spend more each time they visit
Most business owners focus almost entirely on the first one. New customers, new footfall, more marketing. It's the most obvious lever and often the most expensive to pull. Acquiring a new customer costs more than retaining an existing one, and a first-time visitor who never comes back is worth very little.
The second and third levers are where most independents leave money on the table. Getting existing customers back more often, and nudging them to spend a little more when they do, is cheaper, faster, and often more effective than chasing new business. ATV is the direct measure of the third lever.
ATV is the average amount a customer spends per visit.
ATV = Total Revenue / Number of Transactions
If you took £4,200 last week across 840 transactions, ATV is £5.00.
A small increase in ATV compounds fast. Moving from £5.00 to £5.50 on 840 weekly transactions adds £420 a week. Over a year, that's £21,840 in additional revenue without a single new customer through the door.
The main ways to move ATV upward are upselling (offering something additional at the point of sale), bundling (meal deal or combo pricing), and making sure your higher-margin items are the most visible on your menu or in your display.
That last one is worth spending more time on because most independent cafés never bother with it, yet the big chains invest heavily in it.
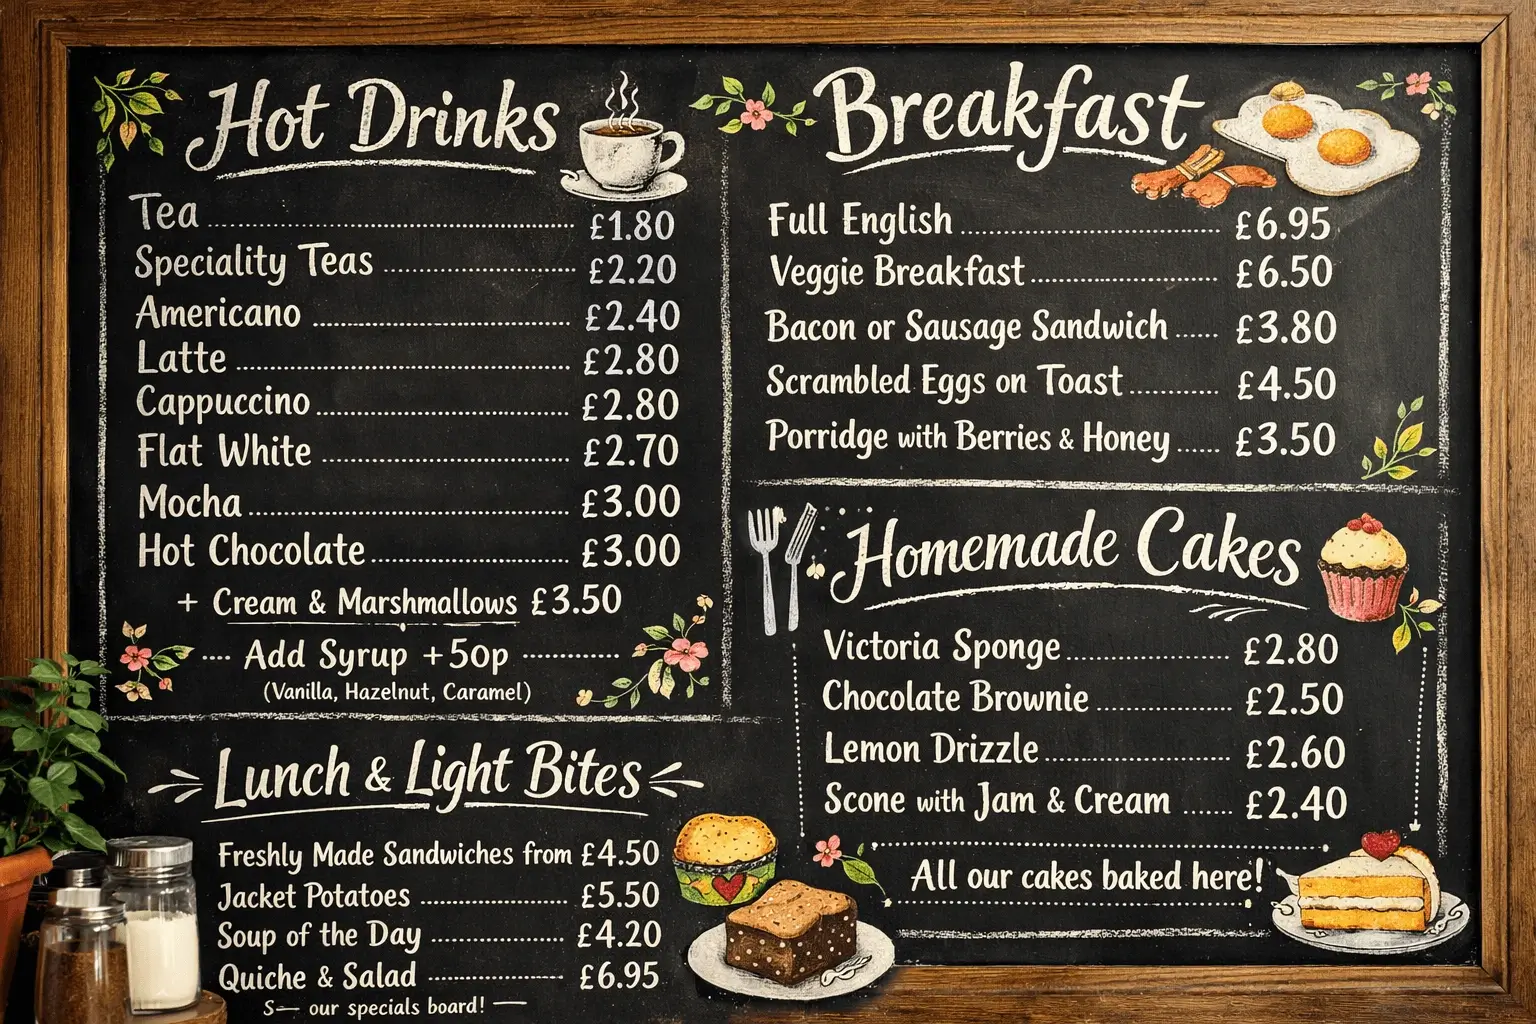
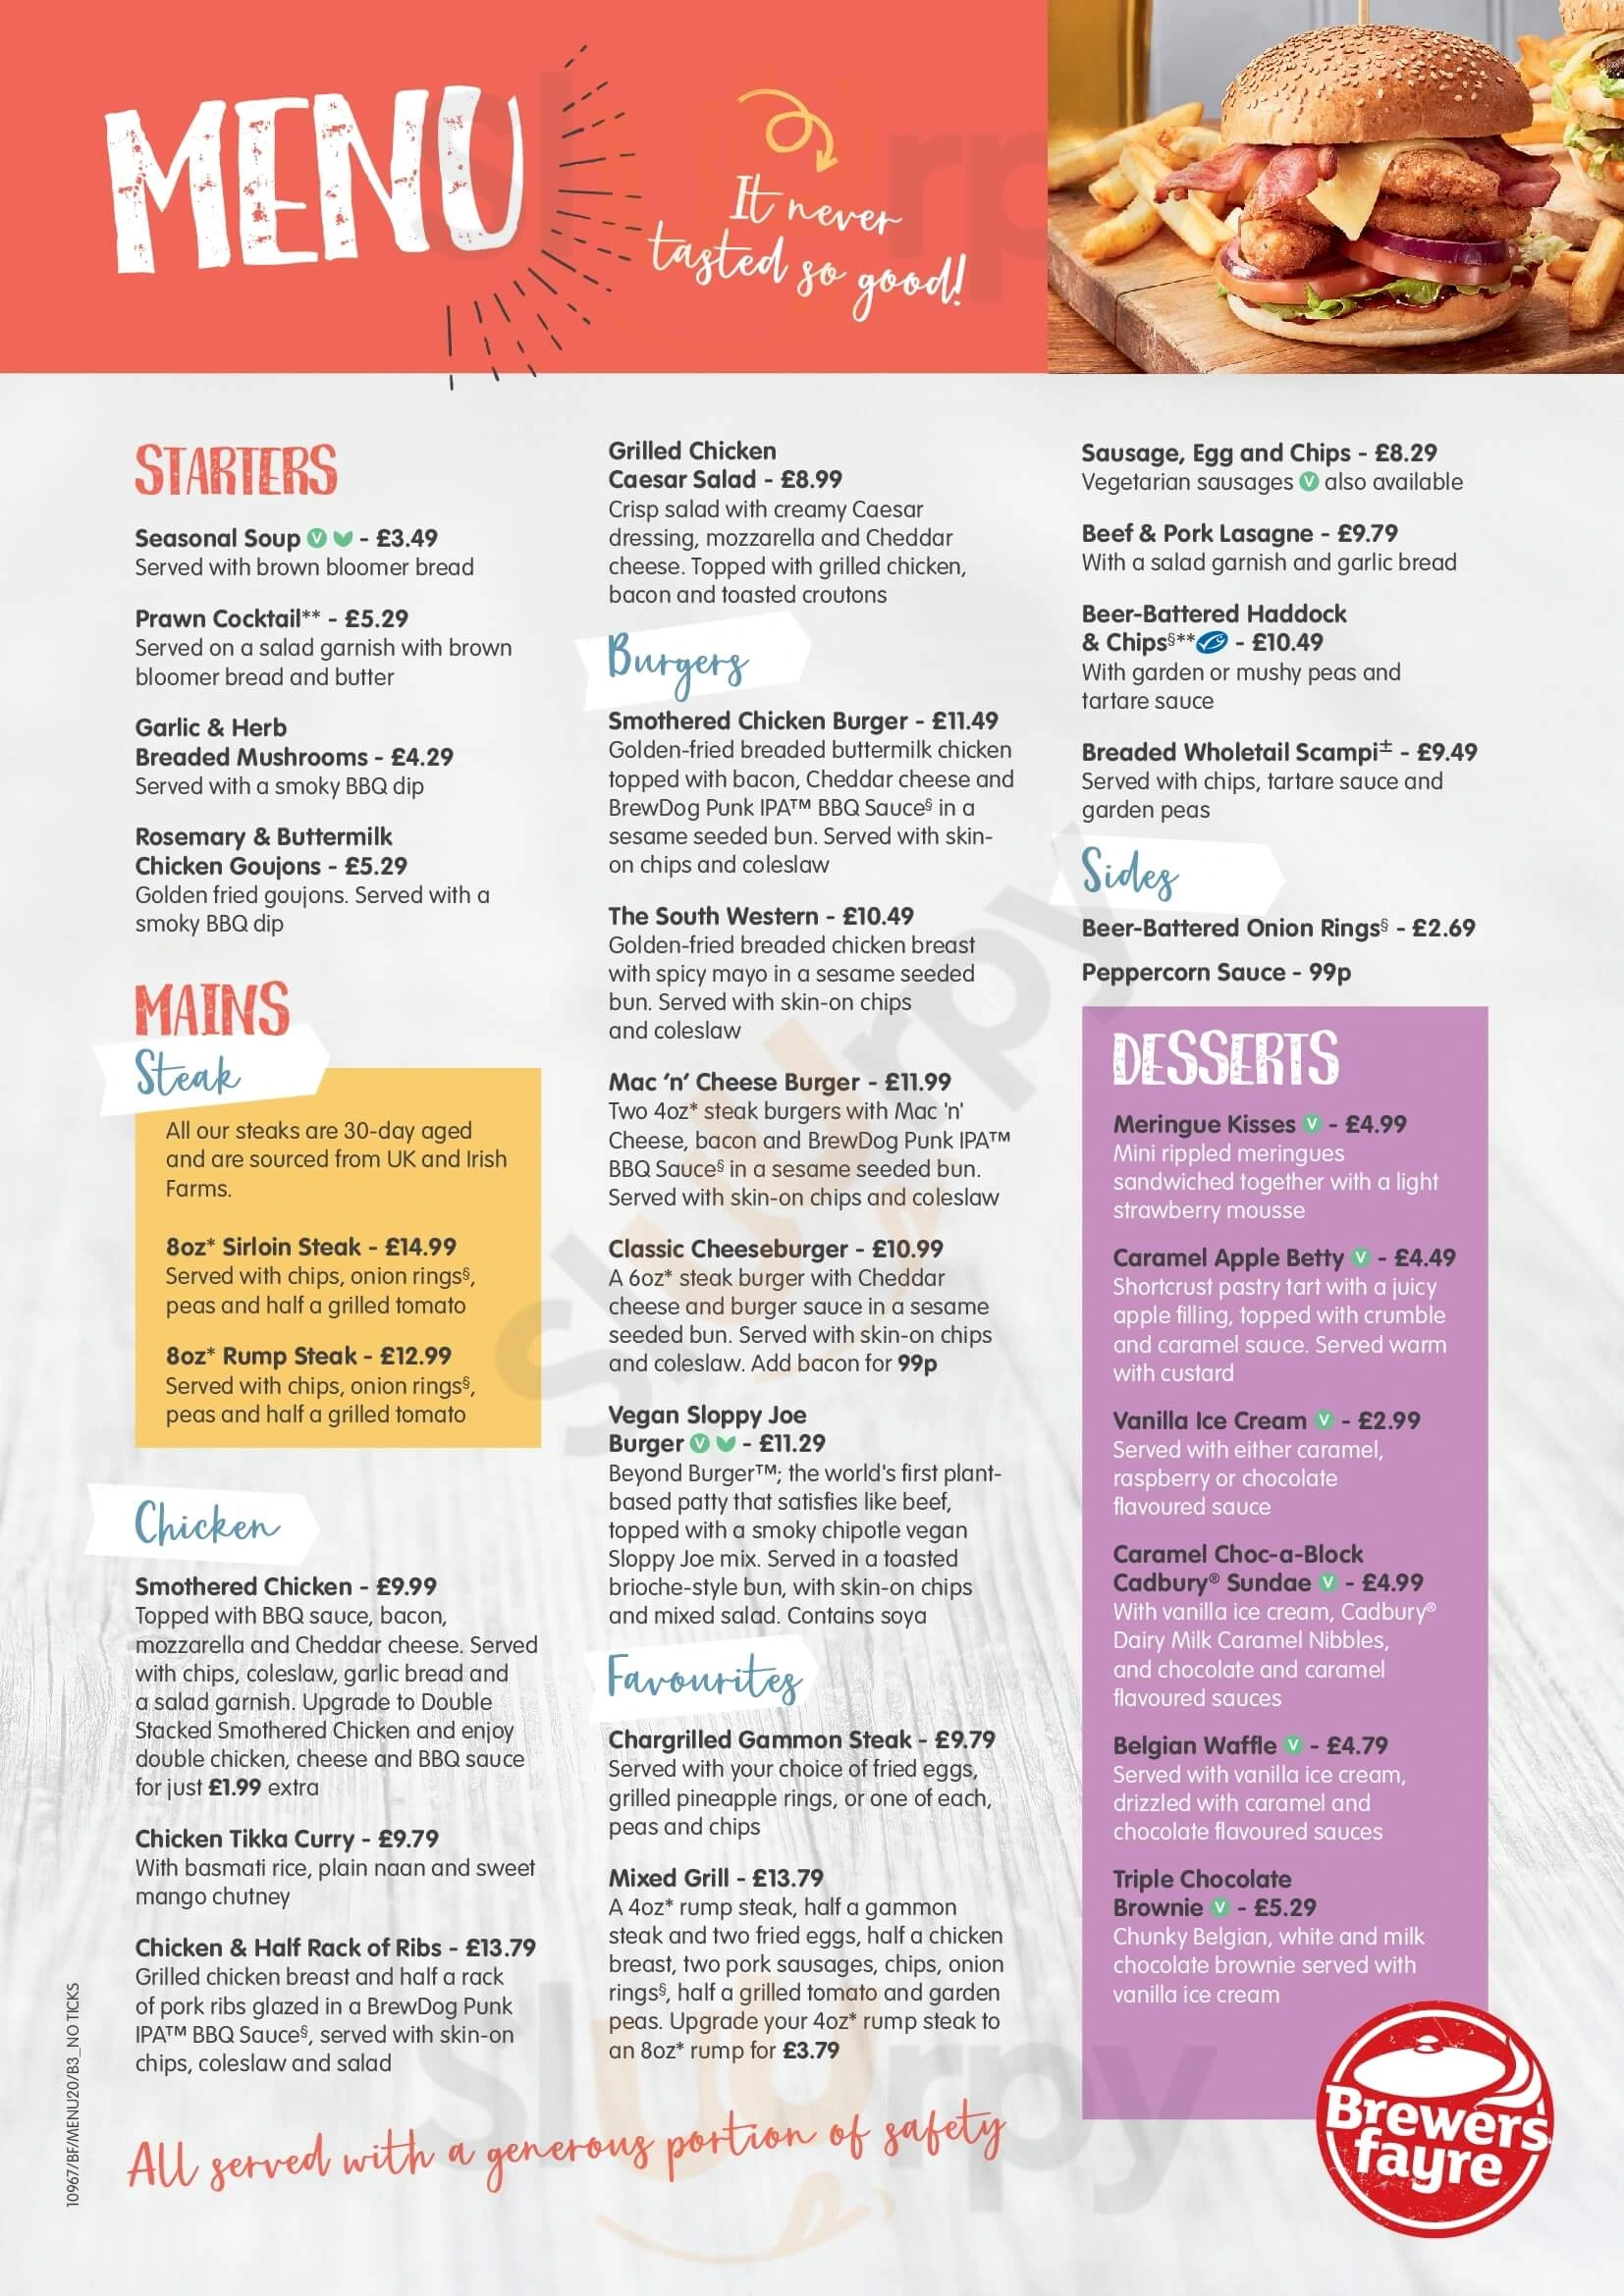
Next time you're in a McDonald's, a Wagamama, or any other chain restaurant, look at the menu properly rather than just reading it. Certain items have a coloured background. Some have a photo while others don't. Some are boxed off or given more space. A few might have a label like "most popular" or "chef's favourite" next to them. None of that is accidental. It's menu engineering, and the items getting the visual treatment are almost always the ones with the strongest margin. The design is doing the selling before the staff say a word.
Independent cafés can apply exactly the same thinking. Put your highest-margin drinks at eye level on the board. Give your best food items a photo or a hand-written description that makes them sound appealing. Box off a meal deal that combines a high-margin drink with a decent-margin food item and price it to feel like good value while still protecting your overall margin. Move things around and see what happens to sales. The menu or display board is one of the most powerful sales tools in the building and most independents treat it as an afterthought.
ATV feeds directly into lifetime customer value, which is covered next and is arguably the most important number on this list.
Lifetime Customer Value (LCV)
LCV is the total revenue a single customer generates over the entire time they keep coming back to you.
LCV = ATV x Average Visits Per Year x Average Customer Lifespan (years)
Take a regular who spends £5.50 per visit, comes in three times a week, and stays loyal for four years.
£5.50 x 156 visits x 4 years = £3,432
One customer. Acquired once. Worth £3,432.
Most café owners think about customers in terms of today's transaction. The LCV calculation reframes the whole thing. That person queuing up at 8am isn't worth £5.50 to you. They're potentially worth thousands. Treat them accordingly.
This is where retention becomes a financial decision, not just a customer service one. A loyalty mechanic changes behaviour in a measurable way. A customer who is on their fifth stamp out of eight isn't just a regular. They have a specific, concrete reason to come back rather than try the place down the road. That increase in visit frequency goes straight into LCV.
PerQ works on exactly that principle. The digital stamp card lives in Apple or Google Wallet, so there's no app for the customer to download and forget about. The next reward is always visible, always one visit closer. More consistent visits means higher LCV. For a café with a decent regular customer base, the difference that makes to annual revenue is not small.
Like for Like (LFL) Sales
LFL is used constantly by retailers, and for good reason. It's one of the most honest measures of whether a business is actually growing.
LFL compares sales performance across the same period in different years, stripping out the distortion of new openings or closures. If you had one site last January and two this January, total turnover is up. But some of that is just the second site adding revenue. LFL looks at the original location only, comparing January this year against January last year, to give you a clean read on whether that business is genuinely improving.
LFL % = ((This Period Sales minus Last Period Sales) / Last Period Sales) x 100
But there's a more useful version of this calculation that the big retailers use, and it's one I applied at Shakes 2GO. Rather than comparing individual months year on year, you track a rolling 12-month total and measure how that moves each month. This strips out seasonality completely.
A milkshake shop is a good example of why that matters. Summers were significantly busier than winters. Comparing August this year against February this year tells you nothing useful. It just reflects the season.
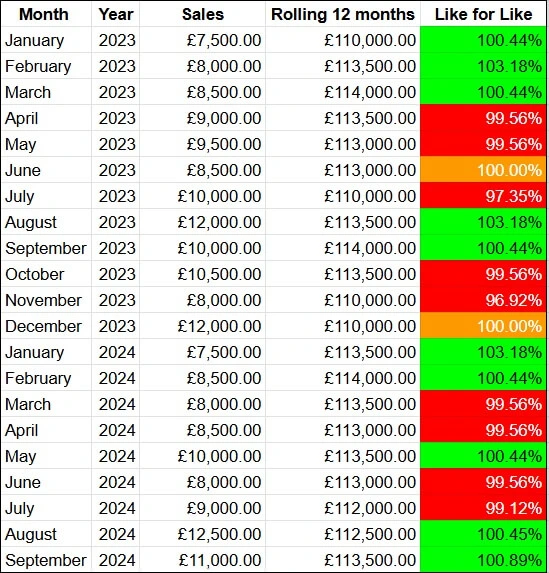
The way I tracked it was a simple spreadsheet with four columns:
Column 1: Month and year in order (March 2023, April 2023, May 2023, and so on)
Column 2: Sales for that individual month
Column 3: Rolling 12-month total sales up to and including that month
Column 4: Percentage change between that month's rolling 12-month total and the previous month's rolling 12-month total
That last column is the one that matters. Any figure above 100% means the business has grown in real terms over the past year. Below 100% means it has shrunk. Because the total always covers a full 12 months, the seasonal peaks and troughs cancel each other out. A bumper August doesn't flatter the number. A quiet February doesn't drag it down. What you're left with is a clean read on whether the business is genuinely moving forward.
Positive LFL means the business is getting stronger on its own terms. Flat LFL with growing costs is a problem developing slowly. Negative LFL needs attention immediately. Big retail groups treat this number as one of the most telling in their annual results. It strips out the noise and shows you what's actually happening.
Most independent café owners track monthly sales and leave it there. Adding this rolling calculation to the same spreadsheet takes about five minutes and gives you a fundamentally different level of clarity on where the business actually stands.
Employee to Turnover Ratio
This measures how efficiently your team is generating revenue, and it's one of the most important ratios to get right in any café or retail business.
Employee to Turnover Ratio = Total Turnover / Number of FTEs
FTE means full-time equivalent. Two people working 20 hours each is one FTE.
If your café turns over £200,000 a year on four FTEs, revenue per FTE is £50,000.
Track this over time rather than against a fixed benchmark. If turnover grows and headcount stays the same, you're getting more efficient. If headcount grows faster than turnover, your labour costs are outpacing your revenue, and your net margin will show it.
Getting this right is harder than it sounds. One of the biggest challenges running Shakes 2GO was forecasting how busy any given day would actually be. A sunny Tuesday in June could be three times busier than a rainy Thursday. A local event could double footfall with very little warning. Calling it accurately enough to know exactly how many staff to put on was genuinely difficult, and getting it wrong in either direction cost money. Overstaff a quiet day and you're paying wages for people standing around. Understaff a busy one and you lose sales, serve customers badly, or both.
The solution I landed on was building a team weighted toward part-time employees with flexible hours rather than a smaller number of full-time staff. It meant I had more people I could call on, and the flexibility to put more bodies on when it was busy and pull back when it wasn't. It also made covering sickness and holidays far less painful. When you have four full-time staff and one calls in sick, you have a serious problem. When you have eight part-time staff across varying shift patterns, you have options.
In hospitality, labour is usually the biggest cost line after food. It also tends to creep up gradually without anyone making a conscious decision to increase it. An extra shift added here, a contracted hour there. Watching the employee to turnover ratio keeps that honest.
Putting It Together
These numbers form a system. Turnover shows volume. Gross margin shows product efficiency. Net profit shows whether the model actually works. ATV and LCV show what your customer relationships are worth. LFL shows whether growth is real. Employee to turnover ratio shows whether your cost base makes sense for the revenue you're generating.
You don't need a complicated setup to track them. A spreadsheet reviewed monthly is enough to start. The point is to build the habit of knowing them, so that when something shifts, you see it early rather than when it's already a problem.
And if you want to move ATV and LCV specifically, a loyalty programme is one of the most direct tools available. Not a complicated points system nobody understands. A simple stamp card that customers actually use, that gives them a reason to come back rather than drift somewhere else.
That's exactly what PerQ does.
Try PerQ free for 30 days
Running an independent café or retail business? PerQ is a digital stamp card loyalty programme built for independent operators. No app download required, no technical setup headaches, and no long-term contracts.